
CXC Home | Search | Help | Image Use Policy | Latest Images | Privacy | Accessibility | Glossary | Q&A
Exponential and Linear Models of the Electromagnetic Spectrum (Middle School)
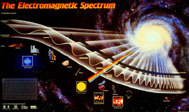
Models of the electromagnetic spectrum similar to the one pictured above are used extensively in textbooks and on posters, and like all other models it contains distortions. The model is extremely useful for showing the frequencies of the different bands of electromagnetic radiation (EMR), and the relationships between frequency and wavelength. However, this is an exponential model, and distorts the actual width of the different bands of radiation. Follow the directions below to construct both models, exponential and linear, on the same chart and compare the two models.
- Use either the template provided or the following instructions to construct the diagram shown below. Tape four pieces of 8 1/2" by 11" paper together end-to-end so that their long sides are on the bottom. The pieces of paper should overlap by 3 cm. Then draw a vertical line down the left side of the chart 2 cm from the edge (see diagram below). From the vertical line just drawn, draw two horizontal lines extending to the right across the pages - one line 8 cm from the top of the paper, and the second line 10 cm below the first horizontal line.

- The top line will be used to plot the exponential model. Along this line, mark off 24 2-cm intervals from the vertical line. Starting at 2 cm, label each interval with increasing powers of ten, from 101 to 1024. These numbers represent the frequency in Hertz of the electromagnetic spectrum. Use the information from the Frequency Range Table on the next page to divide your model into the individual bands of electromagnetic radiation. [Use the entire visible band, not the individual colors.] Record the information in the area above the top line.
EMR Bands Frequency Range
(Hertz)Radio & Microwave Near 0 to 3.0 x 10¹² Infrared 3.0 x 10¹² to 4.6 x 10¹⁴ Visible 4.6 x 10¹⁴ to 7.5 x 10¹⁴ Red 4.6 x 10¹⁴ to 5.1 x 10¹⁴ Orange 5.1 x 10¹⁴ to 5.6 x 10¹⁴ Yellow 5.6 x 10¹⁴ to 6.1 x 10¹⁴ Green 6.1 x 10¹⁴ to 6.5 x 10¹⁴ Blue 6.5 x 10¹⁴ to 7.0 x 10¹⁴ Violet 7.0 x 10¹⁴ to 7.5 x 10¹⁴ Ultraviolet 7.5 x 10¹⁴ to 6.0 x 10¹⁶ X-ray 6.0 x 10¹⁶ to 1.0 x 10²⁰ Gamma Ray 1.0 x 10²⁰ to... - Before constructing the linear model, the frequencies used for the exponential model need to be converted. Those numbers show the range of frequencies, or amount of energy, that each of the bands of EMR covers within the spectrum. Now the individual bands of radiation need to be compared relative to each other by converting all of the bands of EMR to the same frequency range. The frequency range of the visible band - 1014 - has been arbitrarily selected. Convert the frequency numbers for radio and microwave, infrared, ultraviolet, X-ray and gamma ray in the Frequency Conversion Table below to 1014 and record them in the table. [There is a tutorial on converting exponents on the last page.]
EMR Bands Frequency Range
(Hertz)Radio & Microwave Infrared Visible 4.6 x 10¹⁴ to 7.5 x 10¹⁴ Red 4.6 x 10¹⁴ to 5.1 x 10¹⁴ Orange 5.1 x 10¹⁴ to 5.6 x 10¹⁴ Yellow 5.6 x 10¹⁴ to 6.1 x 10¹⁴ Green 6.1 x 10¹⁴ to 6.5 x 10¹⁴ Blue 6.5 x 10¹⁴ to 7.0 x 10¹⁴ Violet 7.0 x 10¹⁴ to 7.5 x 10¹⁴ Ultraviolet X-ray Gamma Ray - Mark off 10 10-cm intervals from the vertical line on the bottom line beneath the exponential model. Starting at the first interval, label each mark as a whole number times 1014, from 1 x 10¹⁴ to 10 x 1014. Label the bottom of the model "Frequency in Hertz." Plot the converted 1014 frequencies for the radio band. Then plot the individual colors of the visible spectrum and color them. Compare the two models.
- Calculate the width of the ultraviolet band. How far does the ultraviolet band extend?
- X-rays are the next band of radiation. Calculate the distance from the end of the ultraviolet band to the end of the X-ray band.
- Based on the results for the width of the X-ray band, what is the width of the gamma ray band of radiation?
- Compare and contrast the two models. What are the distortions in the two models? What is the advantage in using the exponential model? What is the advantage in using the linear model? Are there other ways to model the electromagnetic spectrum?
Using Scientific Notation
Methods such as abbreviations and acronyms are used to make long words or long phrases easier to write. For example, in this activity the acronym EMR is sometimes used instead of the words "ElectroMagnetic Radiation". The acronyms NASA is used instead of the words "National Aeronautics and Space Administration". The same technique is used with numbers, large numbers are shortened by using scientific notation (exponents.) For example, the number 1,000,000 written in scientific notation, or exponential form, is 1 x 10⁶.
100 = 10 x 10 = 1 x 10²
1000 = 10 x 10 x 10 = 1 x 10³
100,000 = 10 x 10 x 10 x 10 x 10 = 1 x 10⁵
What if we wanted to express the number 100 [1 x 10²] as an exponent of 103? The difference between 102 and 103 is one exponent so we would move the decimal one place. Since we are expressing a number as a larger exponent, the decimal place is moved one place to the left, so 1 x 10² becomes 0.1 x 10³.
What if we wanted to express the number 100,000 [1 x 10⁵] as an exponent of 103?
The difference between 105 and 103 is two exponents so we would move the decimal two places. Since we are expressing a number as a smaller exponent, the decimal place is moved two places to the right, so 1 x 10⁵ becomes 100 x 103.
Model Construction Template pdf
Modeling the Electromagnetic Spectrum: Middle School
Modeling the Electromagnetic Spectrum: High School
Revised: March 12, 2008