
1. Time-Lapse Movie Of Crab Pulsar Wind
QuicktimeMPEG Broadcast:
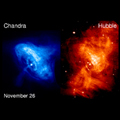
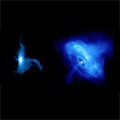
This movie shows dynamic rings, wisps and jets of matter and antimatter around the pulsar in the Crab Nebula as observed in X-ray light by Chandra (left, blue) and optical light by Hubble (right, red). The movie was made from 7 still images of Chandra and Hubble observations taken between November 2000 and April 2001. To produce a movie of reasonable length the sequence was looped several times, as in looped weather satellite images. The inner ring is about one light year across.
[Runtime: 0:19]
(X-ray: NASA/CXC/ASU/J.Hester et al.; Optical: NASA/HST/ASU/J.Hester et al.)
Related Chandra Images:
QuicktimeMPEG Broadcast:
- QuickTime movie (uncompressed)
- D1 (0.9 pixel aspect ratio)
- 720x486
- 29.97 fps
- file size = (978.1 MB)
This movie shows dynamic rings, wisps and jets of matter and antimatter around the pulsar in the Crab Nebula as observed in X-ray light by Chandra (left, blue) and optical light by Hubble (right, red). The movie was made from 7 still images of Chandra and Hubble observations taken between November 2000 and April 2001. To produce a movie of reasonable length the sequence was looped several times, as in looped weather satellite images. The inner ring is about one light year across.
[Runtime: 0:19]
(X-ray: NASA/CXC/ASU/J.Hester et al.; Optical: NASA/HST/ASU/J.Hester et al.)
Related Chandra Images:
- Photo Album: Crab Nebula
2. Animation Of Crab Pulsar Wind
QuicktimeMPEG Broadcast:
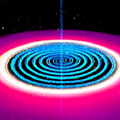
This animation shows how the combination of rapid rotation and a strong magnetic field produces an ultra high-speed flow of particles away from a neutron star. As the flow moves away, it is concentrated along the poles and the equator of the neutron star. A shock wave, which shows up as a bright X-ray ring, marks the boundary between the equatorial flow and the surrounding nebula.
[Runtime: 0:29]
(CXC/D.Berry)
Related Chandra Images:
QuicktimeMPEG Broadcast:
- QuickTime movie (uncompressed)
- D1 (0.9 pixel aspect ratio)
- 720x486
- 29.97 fps
- file size = (900 MB)
This animation shows how the combination of rapid rotation and a strong magnetic field produces an ultra high-speed flow of particles away from a neutron star. As the flow moves away, it is concentrated along the poles and the equator of the neutron star. A shock wave, which shows up as a bright X-ray ring, marks the boundary between the equatorial flow and the surrounding nebula.
[Runtime: 0:29]
(CXC/D.Berry)
Related Chandra Images:
- Photo Album: Crab Nebula
3. Crab Nebula 3-D Motion Simulation
QuicktimeMPEG Broadcast:
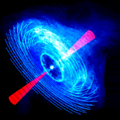
This simulation shows the Chandra X-ray image of the Crab Nebula which fades to a model that rotates, then fades back to the X-ray image. The model of wisp motions includes wisps moving into a +/- 5 degree wedge at 0.53c.
[Runtime: 0:41]
(Animation: NASA/CXC/ASU/J.Hester et al.)
Related Chandra Images:
QuicktimeMPEG Broadcast:
- QuickTime movie (uncompressed)
- D1 (0.9 pixel aspect ratio)
- 720x486
- 29.97 fps
- file size = (1.2 GB)
This simulation shows the Chandra X-ray image of the Crab Nebula which fades to a model that rotates, then fades back to the X-ray image. The model of wisp motions includes wisps moving into a +/- 5 degree wedge at 0.53c.
[Runtime: 0:41]
(Animation: NASA/CXC/ASU/J.Hester et al.)
Related Chandra Images:
- Photo Album: Crab Nebula
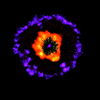
4. Animation Of Crab Nebula Geometry And Structure
QuicktimeMPEG Broadcast:
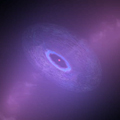
This artist's conception shows how material from the rotating, magnetized neutron star at the heart of the Crab Nebula is flung outward and along the axis to form a thick ring and jets.
[Runtime: 0:16]
(NASA/CXC/A.Hobart)
Related Chandra Images:
QuicktimeMPEG Broadcast:
- QuickTime movie (uncompressed)
- D1 (0.9 pixel aspect ratio)
- 720x486
- 29.97 fps
- file size = (499.5 MB)
This artist's conception shows how material from the rotating, magnetized neutron star at the heart of the Crab Nebula is flung outward and along the axis to form a thick ring and jets.
[Runtime: 0:16]
(NASA/CXC/A.Hobart)
Related Chandra Images:
- Photo Album: Crab Nebula
5. Comparison of 3C58 and the Crab Nebula
QuicktimeMPEG Broadcast:
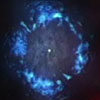
In this series of X-ray images, the strong similarities between the center of 3C58 and the Crab Nebula pulsar -- one of the most famous objects in astronomy -- are shown. The 3C58 pulsar, the Crab Nebula pulsar, and a growing list of other pulsars offer dramatic proof that strong electromagnetic fields around rapidly rotating neutron stars are powerful generators of both high-energy particles and magnetic fields.
[Runtime: 0:22]
(3C58: NASA/CXC/SAO/P.Slane et al.; Crab: NASA/CXC/ASU/J.Hester et al.)
Related Chandra Images:
QuicktimeMPEG Broadcast:
- QuickTime movie (uncompressed)
- D1 (0.9 pixel aspect ratio)
- 720x486
- 29.97 fps
- file size = (660.7 MB)
In this series of X-ray images, the strong similarities between the center of 3C58 and the Crab Nebula pulsar -- one of the most famous objects in astronomy -- are shown. The 3C58 pulsar, the Crab Nebula pulsar, and a growing list of other pulsars offer dramatic proof that strong electromagnetic fields around rapidly rotating neutron stars are powerful generators of both high-energy particles and magnetic fields.
[Runtime: 0:22]
(3C58: NASA/CXC/SAO/P.Slane et al.; Crab: NASA/CXC/ASU/J.Hester et al.)
Related Chandra Images:
- Photo Album: 3C58
- Photo Album: Crab Nebula
6. 3C58: Layers of Chandra's 3-Color Image
QuicktimeMPEG Broadcast:
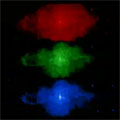
n this sequence, the individual layers that comprise the Chandra 3-color image of 3C58 are shown. The red layer represents the lower-energy X-rays, green shows the medium-energy range, and blue reveals the highest-energy X-rays observed by Chandra.
[Runtime: 0:20]
(NASA/CXC/SAO/P.Slane et al.)
Related Chandra Images:
QuicktimeMPEG Broadcast:
- QuickTime movie (uncompressed)
- D1 (0.9 pixel aspect ratio)
- 720x486
- 29.97 fps
- file size = (600.6 MB)
n this sequence, the individual layers that comprise the Chandra 3-color image of 3C58 are shown. The red layer represents the lower-energy X-rays, green shows the medium-energy range, and blue reveals the highest-energy X-rays observed by Chandra.
[Runtime: 0:20]
(NASA/CXC/SAO/P.Slane et al.)
Related Chandra Images:
- Photo Album: 3C58
7. Multi-wavelength Look at 3C58
QuicktimeMPEG Broadcast:
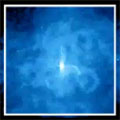
This sequence compares Chandra's X-ray image of 3C58 with the views seen by optical and radio telescopes. The intricate X-ray loops in the Chandra image and the features in the radio images of 3C58 extend a dozen light years from the pulsar, likely representing the complex magnetic field structure there.
[Runtime: 0:32]
(X-ray: NASA/CXC/SAO/P.Slane et al.; Optical: DSS; Radio: NCSU/S.Reynolds)
Related Chandra Images:
QuicktimeMPEG Broadcast:
- QuickTime movie (uncompressed)
- D1 (0.9 pixel aspect ratio)
- 720x486
- 29.97 fps
- file size = (961 MB)
This sequence compares Chandra's X-ray image of 3C58 with the views seen by optical and radio telescopes. The intricate X-ray loops in the Chandra image and the features in the radio images of 3C58 extend a dozen light years from the pulsar, likely representing the complex magnetic field structure there.
[Runtime: 0:32]
(X-ray: NASA/CXC/SAO/P.Slane et al.; Optical: DSS; Radio: NCSU/S.Reynolds)
Related Chandra Images:
- Photo Album: 3C58
8. SUPERNOVA EXPLOSION (with Dissolve to Cassiopeia A)
QuicktimeMPEG This animation of a supernova explosion dissolves into the Chandra First Light Image, Cassiopeia A.
[Runtime: 0:31]
(Animation: NASA/CXC/D.Berry & A.Hobart)
Related Chandra Images:
QuicktimeMPEG This animation of a supernova explosion dissolves into the Chandra First Light Image, Cassiopeia A.
[Runtime: 0:31]
(Animation: NASA/CXC/D.Berry & A.Hobart)
Related Chandra Images:
- Photo Album: Cassiopeia A
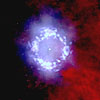
10. SN 1987A Animation
QuicktimeMPEG Broadcast:
The animation illustrates the events following the supernova 1987A outburst. The blue ring is previously observed material ejected from the star thousands of years ago. The expanding orange and yellow shell is multimillion degree, X-ray emitting gas produced by the explosion. Portions of the blue ring light up when struck by the X-ray shell.
[Runtime: 0:22]
(Animation: NASA/CXC/D.Berry)
Related Chandra Images:
QuicktimeMPEG Broadcast:
- QuickTime movie (uncompressed)
- D1 (0.9 pixel aspect ratio)
- 720x486
- 29.97 fps
- file size = (660.7 MB)
The animation illustrates the events following the supernova 1987A outburst. The blue ring is previously observed material ejected from the star thousands of years ago. The expanding orange and yellow shell is multimillion degree, X-ray emitting gas produced by the explosion. Portions of the blue ring light up when struck by the X-ray shell.
[Runtime: 0:22]
(Animation: NASA/CXC/D.Berry)
Related Chandra Images:
- Photo Album: Supernova 1987A

Revised: March 24, 2023