Modeling, Mapping and Made with Code: Two Summer Internships at the Chandra Operations Control Center
We are very pleased to welcome two special guest contributors to the Chandra blog. Amy Nuccitelli and Jonathan Brande both spent the summer of 2016 working as interns with the Chandra X-ray Observatory team at its Operations Control Center. Amy Nuccitelli will enter her junior year as a mathematics major at James Madison University in Harrison, VA, while Jonathan is pursuing a major in astronomy and a minor in computer science at the University of Maryland, College Park. We thank Amy and Jonathan both for their hard work on the Chandra mission and also for taking the time to share their experiences with the Chandra bog.
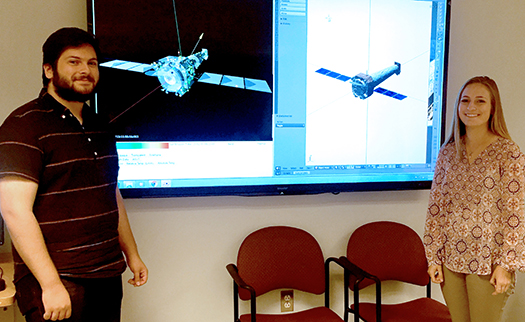
Jonathan Brande and Amy Nuccitelli
Amy:
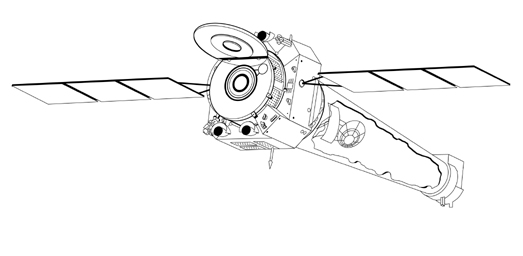
The main goal of our project this summer was to create a 3D model of the Chandra X-ray Observatory and visually represent the telemetry data coming down from the spacecraft, specifically thermal telemetry, using an easy access web design. The model will allow one to see, in just a quick glance, the areas of the spacecraft that are cold, hot, or neutral based on a color spectrum representing the temperature at each thermistor. The model will also allow one to look at real time flight data, or go back and see the temperature at different times in the mission. These functions allow for a quick and responsive view of the thermal telemetry throughout the spacecraft without having to tediously look through multiple databases.
I was responsible for the creation of the 3D model and locating the thermistors throughout the spacecraft. The 3D model was created using a free downloadable software package, Blender, and was then exported into the JavaScript program. In order to create the model, I used engineering blueprints and built as much as I could to scale. I then added more of the details of the spacecraft using images from documents found in the engineering library and online. This 3D model was used as the main object of the website that would visually show telemetry information. After creating the model, I was responsible for locating as many thermistors as possible. These thermistors are graphed on the model as little spheres and then given a color based off of its temperature at any given time. As a final task, I added overlays to the 3D model to give it a realistic material look and texture.
Working with the Chandra team this summer has allowed me to gain valuable knowledge about spacecraft engineering and astronomy. This opportunity has strengthened my desire to pursue a career path in aeronautics that would allow me to creatively apply my mathematical skills. I cannot thank the NASA Space Grant, and the Operational Control Center, enough for giving me this invaluable experience.
Jonathan:
This summer, I had the privilege of an internship at the Chandra X-Ray Observatory Operations Control Center, funded by the NASA Space Grant Consortium. I worked with one other intern, Amy Nuccitelli, to develop a 3D interactive web browser display of the Chandra spacecraft showing live spacecraft telemetry. From the beginning of the project, Mark Baski (our supervisor) made it clear that this was an intern-driven opportunity. Other than an initial set of requirements, we were expected to create our own design plan for the project. We presented the design plan to the rest of the Chandra software team, and regularly reported our progress at weekly meetings.
In order to complete the project, we needed to find all of the relevant thermal sensors on the spacecraft, and we needed a 3D model of the spacecraft. Amy took charge on sifting through the extensive engineering libraries for dimensional information, thermal data, and coordinates. She also used all that information to create the model used for the website, as well as a spreadsheet containing all of the information about the thermal sensors displayed on the model.
I worked mostly on the website code. I spent some time investigating the technologies I would need for in-browser interactive 3D graphics, and outlining the structure of the website. After that, it was a process of building and testing the functionality of the website in stages. First, I had to be able to load and display the 3D model in the browser, and then added mouse and camera controls. I had to be able to access the telemetry server and get the thermal sensor data, and then use that data to color the plotted points on the model. In addition, I used Amy’s spreadsheet to compile a separate file holding all the metadata I wanted to show in the website, and then set up that file to be loaded into the site. Finally, I spent a significant amount of time trying to streamline the user experience, with feedback from other engineers at the OCC. Their suggestions have turned a fairly basic web view into a functional website, useful in multiple spacecraft support applications.
Please note this is a moderated blog. No pornography, spam, profanity or discriminatory remarks are allowed. No personal attacks are allowed. Users should stay on topic to keep it relevant for the readers.
Read the privacy statement