These four images represent a sample of galaxy clusters that are part of the largest and most complete study to learn what triggers stars to form in the universe’s biggest galaxies, as described in our latest press release. This research, made using NASA’s Chandra X-ray Observatory and other telescopes, showed that the conditions for stellar conception in these exceptionally massive galaxies have not changed over the last ten billion years.
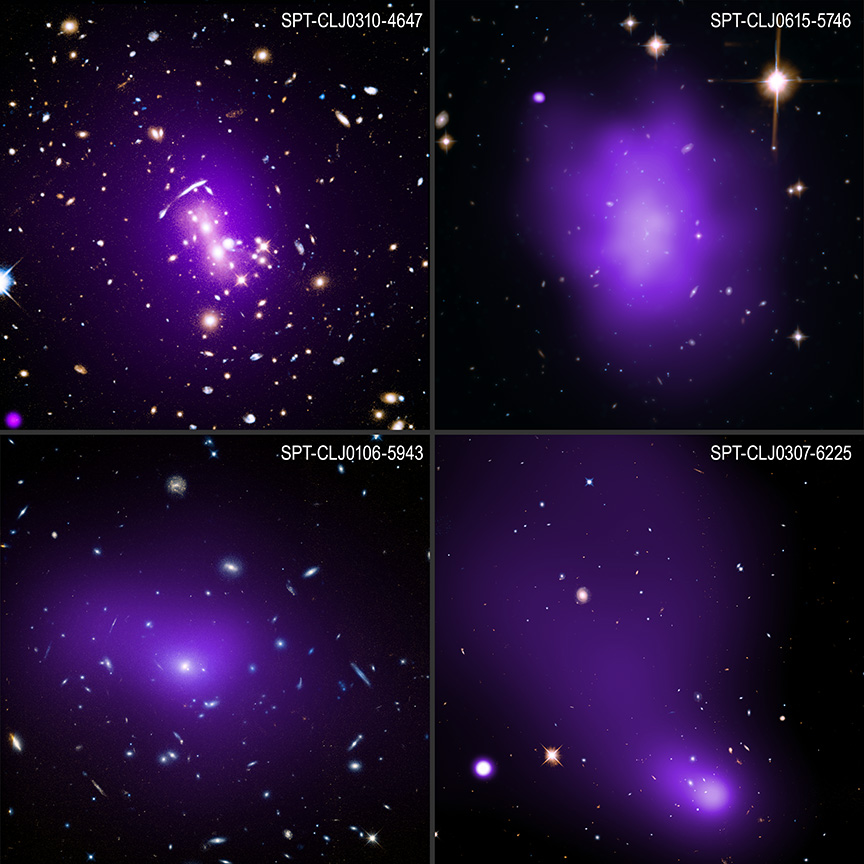
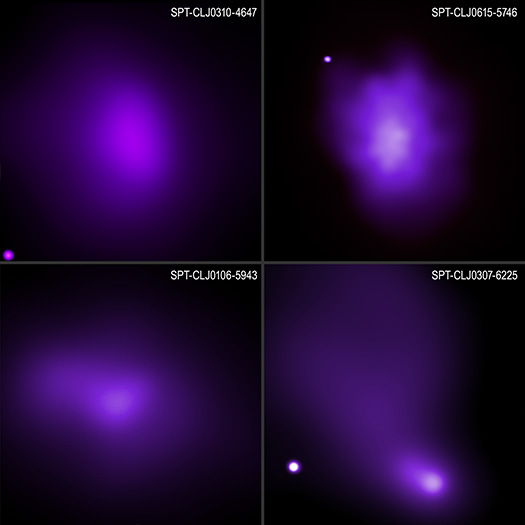
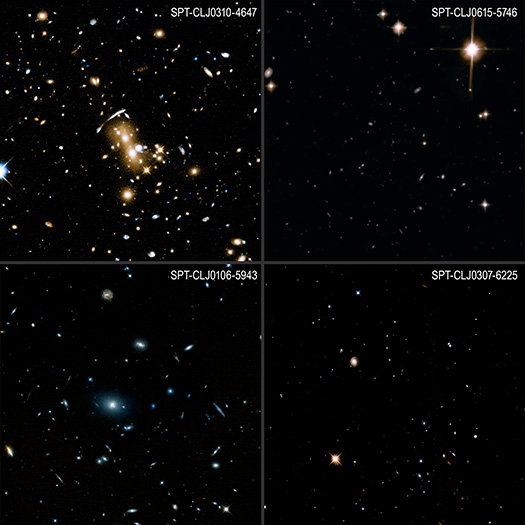
Galaxy clusters are the largest objects in the universe held together by gravity and contain huge amounts of hot gas seen in X-rays. This hot gas weighs several times the total mass of all the stars in all the hundreds of galaxies typically found in galaxy clusters. In the four galaxy cluster images in this graphic, X-rays from hot gas detected by Chandra are in purple and optical data from NASA’s Hubble Space Telescope, mostly showing galaxies in the clusters, are yellow and cyan.
In this study, researchers looked at the brightest and most massive class of galaxies in the universe, called brightest cluster galaxies (BCGs), in the centers of 95 clusters of galaxies. The galaxy clusters chosen are themselves an extreme sample — the most massive clusters in a large survey using the South Pole Telescope (SPT), with funding support from the National Science Foundation and Department of Energy — and are located between 3.4 and 9.9 billion light-years from Earth.
The four galaxy clusters shown here at located at distances of 3.9 billion (SPT-CLJ0106-5943), 5.6 billion (SPT-CLJ0307-6225), 6.4 billion (SPT-CLJ0310-4647) and 7.7 billion (SPT-CLJ0615-5746) light-years from Earth, and the images are 1.7 million, 2 million, 2.4 million and 2.2 million light-years across, respectively. By comparison our galaxy is only about 100,000 light-years across.
In SPT-CLJ0307-6225 the BCG is near the bottom right of the image and in the other images they are near the centers. Some of the long, narrow features are caused by gravitational lensing, where mass in the clusters is warping the light from galaxies behind the clusters. The images have been rotated from standard astronomer’s configuration of North up by 20 degrees clockwise (SPT-CLJ0106-5943), 6.2 degrees counterclockwise (SPT-CLJ0307-6225), 29,2 degrees counterclockwise (SPT-CLJ0310-4647) and 24.2 degrees clockwise (SPT-CLJ0615-5746).
The team found that the precise trigger for stars to form in the galaxies that they studied is when the amount of disordered motion in the hot gas — a physical concept called “entropy” — falls below a critical threshold. Below this threshold, the hot gas inevitably cools to form new stars.
In addition to the X-ray data from Chandra X-ray Observatory and radio data from the SPT already mentioned, this result also used radio data from the Australia Telescope Compact Array, and the Australian SKA Pathfinder Telescope, infrared data from NASA’s WISE satellite, and several optical telescopes. The optical telescopes used in this study were the Magellan 6.5-m Telescopes, the Gemini South Telescope, the Blanco 4-m Telescope (DECam, MOSAIC-II) and the Swope 1m Telescope. A total of almost 50 days of Chandra observing time was used for this result.
Michael Caldazilla of the Massachusetts Institute of Technology (MIT) presented these results at the 243rd meeting of the American Astronomical Society in New Orleans, LA. In addition, there is a paper submitted to The Astrophysical Journal led by Caldazilla on this result (preprint here). The other authors on the paper are Michael McDonald (MIT), Bradford Benson (University of Chicago), Lindsay Bleem (Argonne National Laboratory), Judith Croston (The Open University, UK), Megan Donahue (Michigan State University), Alastair Edge (University of Durham, UK), Gordon Garmire (Penn State University), Julie Hvalacek-Larrondo (University of Colorado), Minh Huynh (CSIRO, Australia), Gourav Khullar (University of Pittsburgh), Ralph Kraft (Center for Astrophysics | Harvard & Smithsonian), Brian McNamara (University of Waterloo, Canada), Allison Noble (Arizona State University), Charles Romero (CfA), Florian Ruppin (University of Lyon, France), Taweewat Somboonpanyakul (Stanford University), and Mark Voit (Michigan State).
NASA's Marshall Space Flight Center manages the Chandra program. The Smithsonian Astrophysical Observatory's Chandra X-ray Center controls science operations from Cambridge, Massachusetts, and flight operations from Burlington, Massachusetts.
This release includes composite images of four galaxy clusters, presented in a two-by-two grid. Each image features a hazy, purple cloud representing X-rays from hot gas observed by Chandra. The distant galaxies in and around the clouds of hot gas have been captured in optical data, and are shown in golden yellows with hints of vibrant cyan blue.
The galaxy cluster at our upper left is labeled SPT-CLJ0310-4647. Here, the blackness of space is packed with gleaming specks of white, golden yellow, and bright blue light. These are individual galaxies. Some of the galaxies resemble blurred, glowing dots. In other galaxies, the curving arms of a spiral formation are discernible. At the center of the image, a faint purple cloud surrounds several of the cluster's brightest galaxies.
At our upper right is an image of SPT-CLJ0615-5746. This is the most distant cluster of the four so the galaxies it contains appear relatively small. These galaxies are mostly located near the center of the image. The purple cloud of hot gas is roughly spherical, and has a light purple spot at its core.
At our lower right is SPT-CLJ0307-6225. Here, X-rays from hot gas are represented by a large, misty, purple cloud that covers much of the image. The brightest spot in the cloud is a light purple dot near our lower right. The most notable galaxy in this image is a pixilated spiral galaxy above and to our left of center.
The galaxy cluster at our lower left is labeled SPT-CLJ0106-5943. This cluster features a scattering of cyan blue galaxies, several of which appear stretched or elongated due to gravitational lensing. At the center of the image is a purple gas cloud with a bright white speck at its core.
|
|||||||||||||||||||||||||||||
|
|||||||||||||||||||||||||||||
|
|||||||||||||||||||||||||||||
|
|||||||||||||||||||||||||||||