
CXC Home | Search | Help | Image Use Policy | Latest Images | Privacy | Accessibility | Glossary | Q&A
1
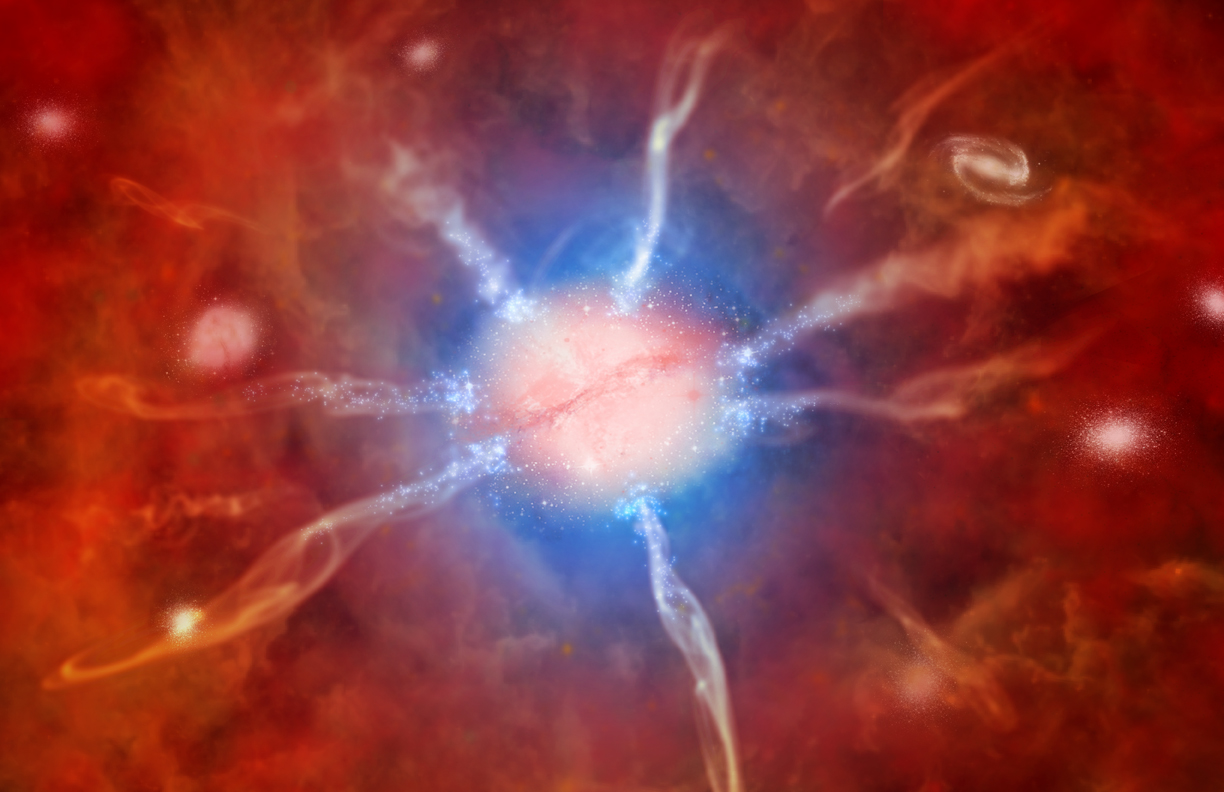
Artist's impression of galaxy at center of Phoenix Cluster
The hot gas in Phoenix is giving off copious amounts of X-rays and cooling quickly over time, especially near the center of the cluster, causing gas to flow inwards and form huge numbers of stars at the base of the flows. These features are shown in this artist's impression of the central galaxy, with hot gas shown in red, cooler gas shown in blue, the gas flows shown by the ribbon-like features and the newly formed stars in blue, in the outer part of the galaxy.
(Credit: NASA/CXC/M.Weiss)
2
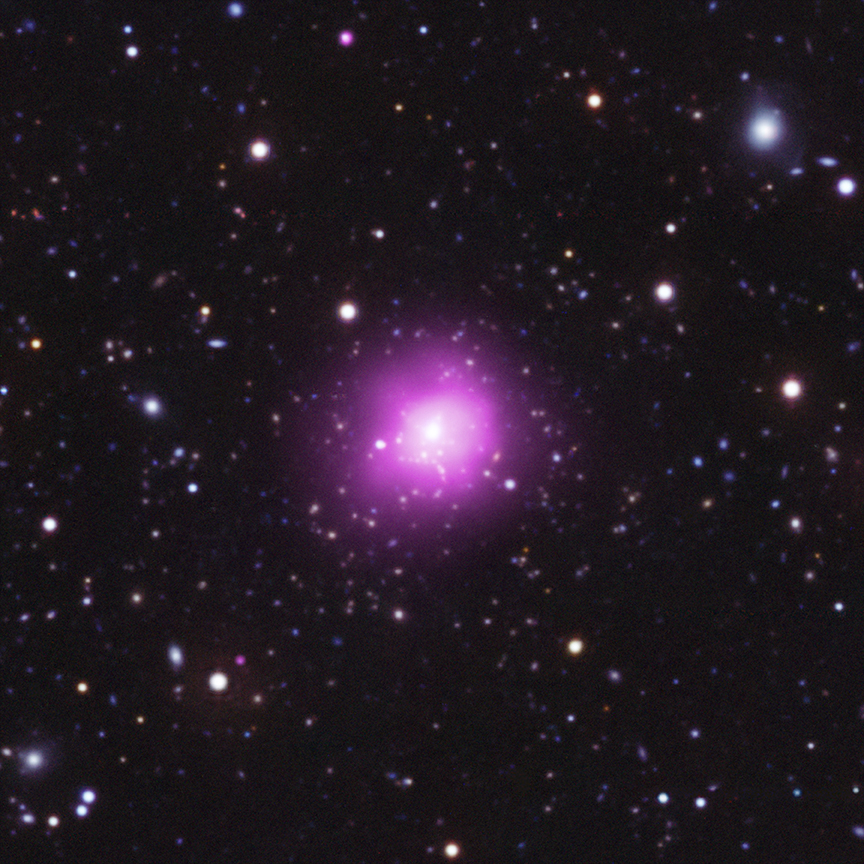
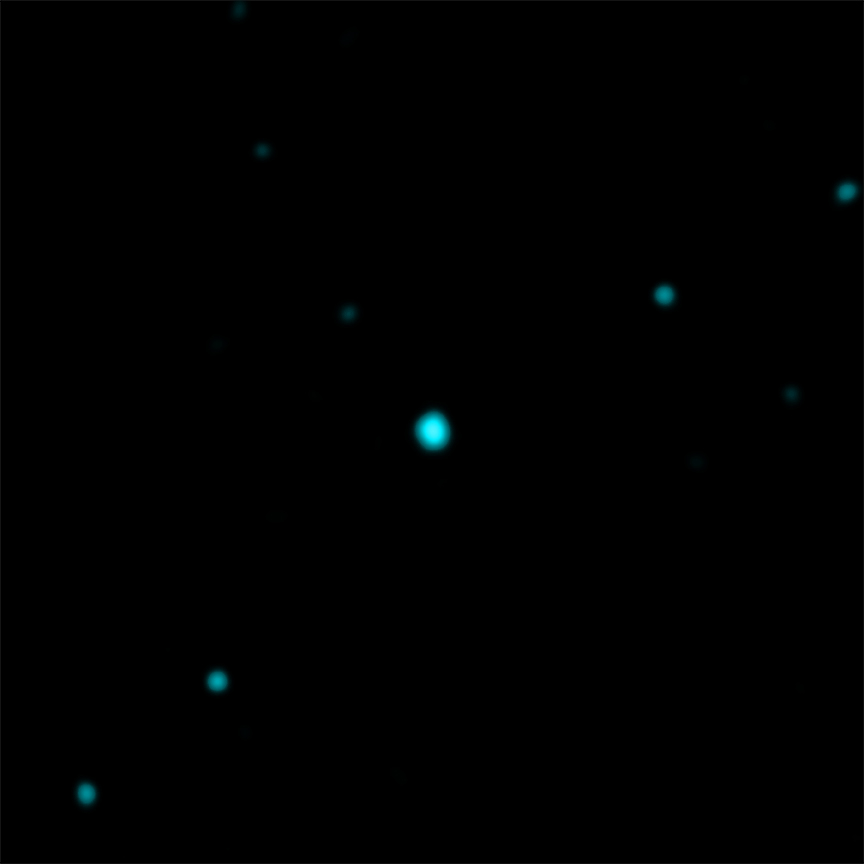
X-ray, UV and Optical Images of Phoenix Cluster
These images of the Phoenix Cluster begin on the left with a composite image showing X-ray data from NASA's Chandra X-ray Observatory in purple, an ultraviolet (UV) image from NASA's Galaxy Evolution Explorer (GALEX) in blue and an optical image from the 4m Blanco telescope in red, green and blue. The Chandra data shows hot gas in the cluster and the optical and UV images show galaxies in the cluster and in nearby parts of the sky. A composite UV and optical image is then shown, followed by the Chandra X-ray and GALEX UV images shown separately.
(Credit: X-ray: NASA/CXC/MIT/M.McDonald; UV: NASA/JPL-Caltech/M.McDonald; Optical: AURA/NOAO/CTIO/MIT/M.McDonald)
3
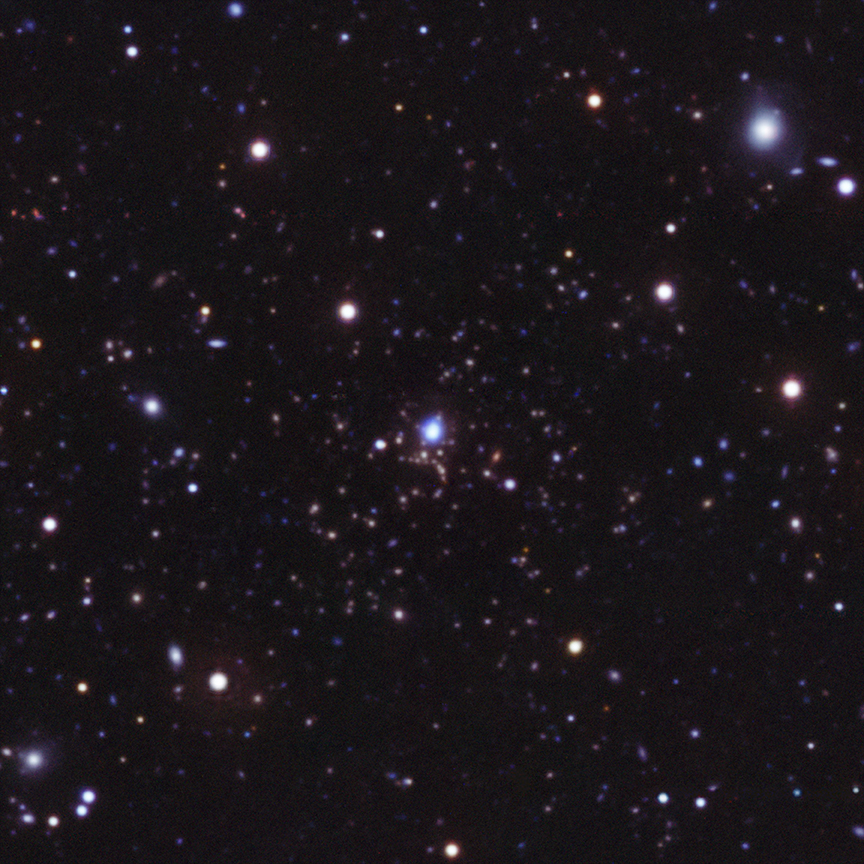
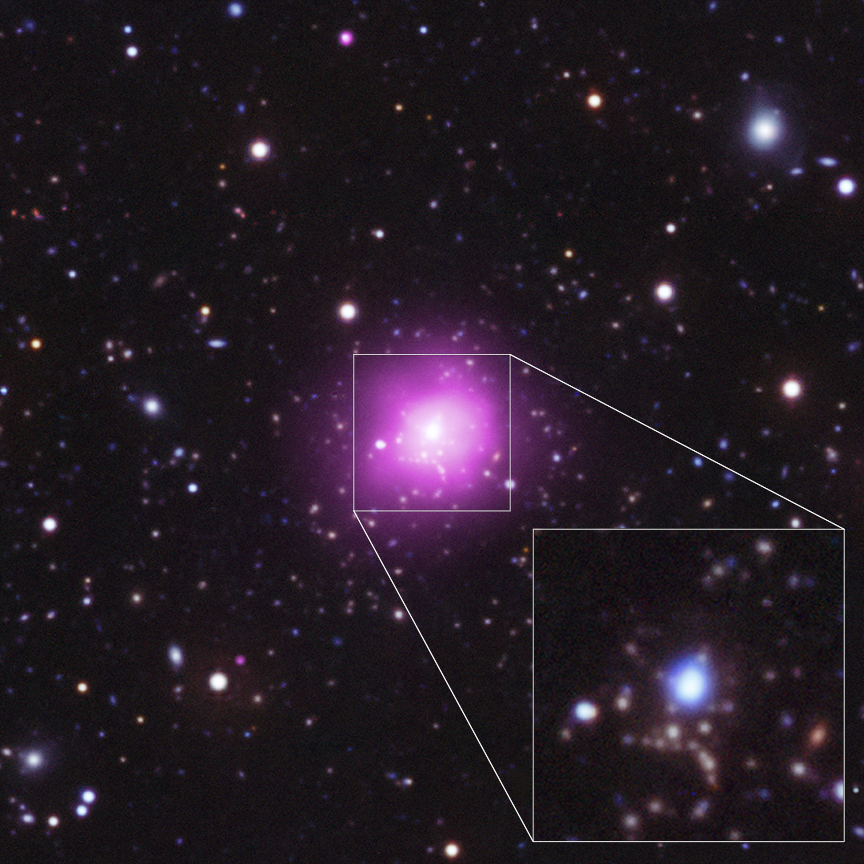
Composite Image of Phoenix Cluster with Close-up in UV and Optical
This image shows the X-ray/UV/optical composite with a pull-out of the UV/optical composite showing the central part of the Phoenix Cluster. Data from NASA's Chandra X-ray Observatory is in purple, an ultraviolet (UV) image from NASA's Galaxy Evolution Explorer (GALEX) is in blue and an optical image from the 4m Blanco telescope is in red, green and blue. The pull-out shows that the central galaxy has much bluer colors than the nearby galaxies in the cluster, revealing the presence of large numbers of hot, young massive stars because of the enormous rate at which stars are forming.
(Credit: X-ray: NASA/CXC/MIT/M.McDonald; UV: NASA/JPL-Caltech/M.McDonald; Optical: AURA/NOAO/CTIO/MIT/M.McDonald)
4
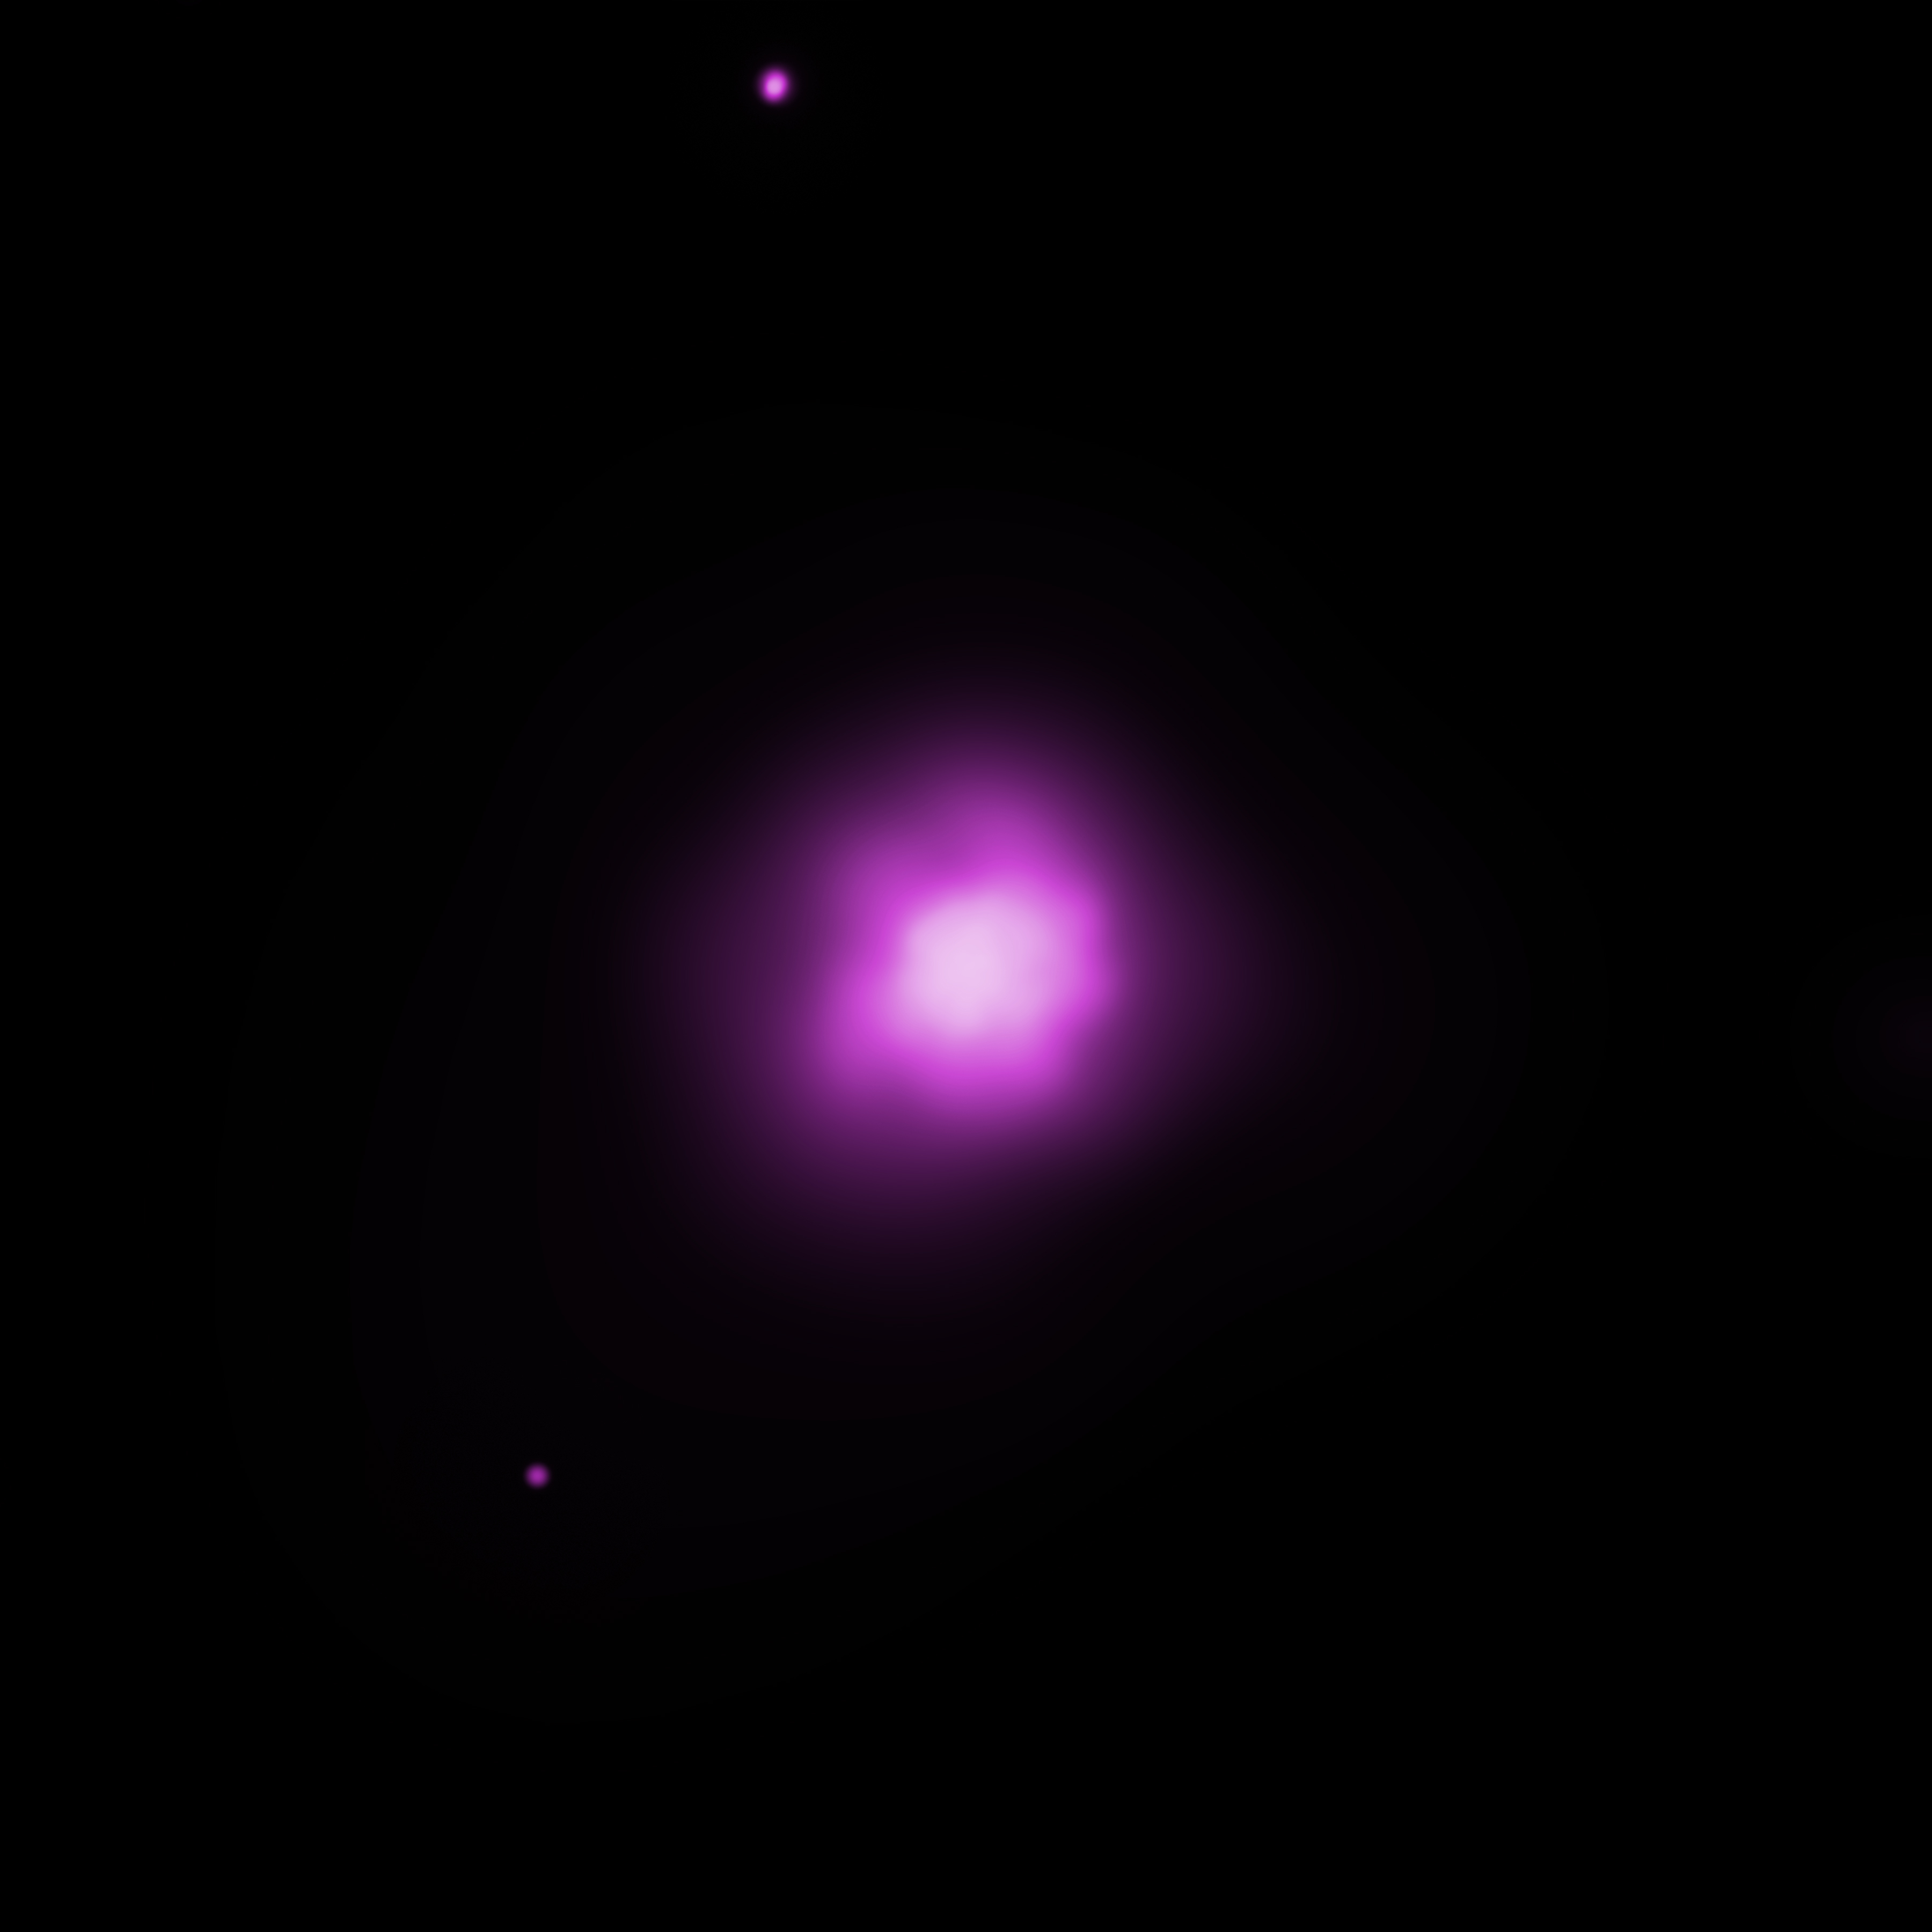
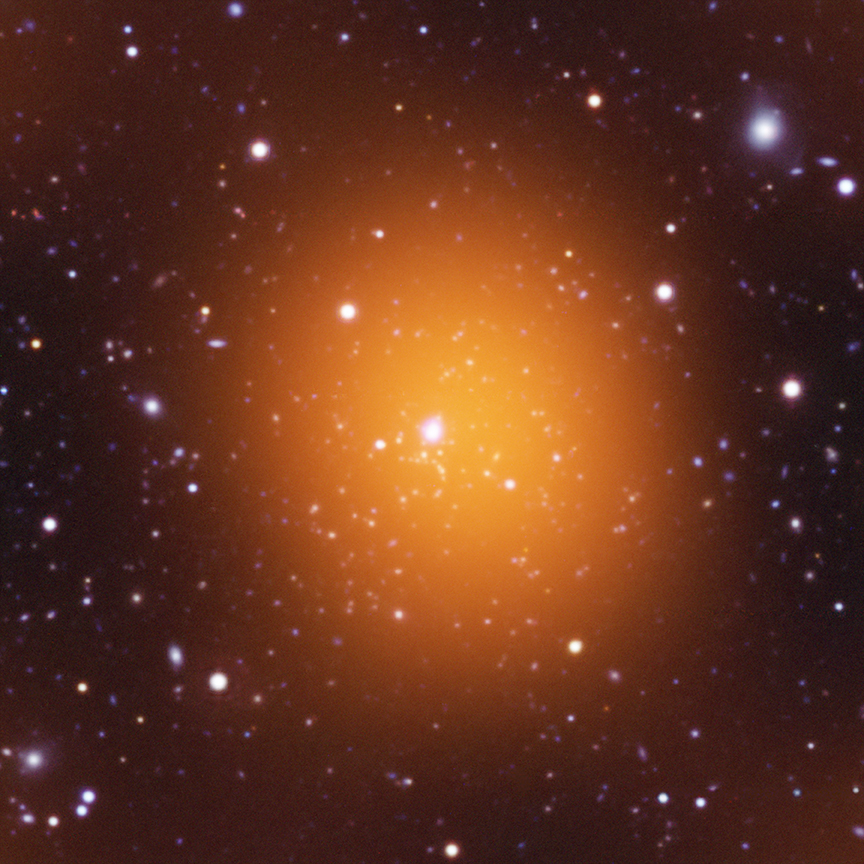
UV, Optical and Microwave image of Phoenix Cluster
This composite image shows a microwave image of the Phoenix Cluster from the NSF's South Pole Telescope in orange, combined with UV (blue) and optical (red, green, blue) images. The microwave image made use of the Sunyaev-Zeldovich effect to discover the Phoenix Cluster. In this phenomenon, photons in the cosmic microwave background (CMB), the radiation remaining after the Big Bang, interact with electrons in the hot gas that pervades the galaxy cluster. The photons acquire energy from this interaction, which distorts the signal from the CMB in the direction of the cluster.
(Credit: UV: NASA/JPL-Caltech/M.McDonald; Optical: AURA/NOAO/CTIO/MIT/M.McDonald; Microwave: NSF/SPT)
5
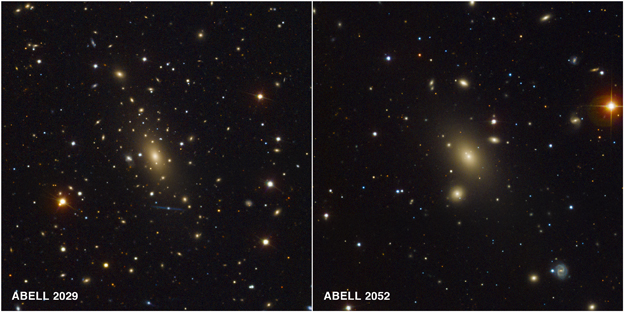
Sloan Digital Sky Survey Optical Images of Abell 2029 & Abell 2052
These two optical images from the Sloan Digital Sky Survey, in red, green and blue, show the galaxy clusters Abell 2029 and Abell 2052, located about one billion and 480 million light years from Earth, respectively. The colors of the galaxies provide information about the age of their stellar populations, because the light from young stars is dominated by blue light from hot, massive stars, and old stars have red colors. The red colors of the member galaxies in both clusters, including the large elliptical galaxy in the center, implies that the galaxies have low rates of star formation, inspiring the saying by astronomers that galaxies in clusters are typically "red and dead".
(Credit: SDSS)
6
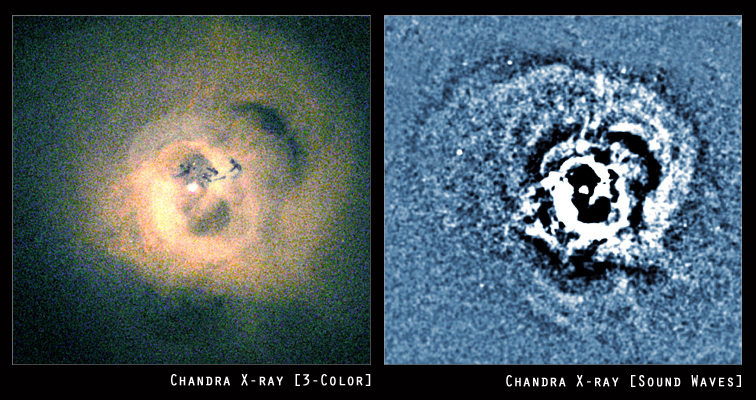
Cavities and sound waves in the Perseus Cluster
The famous Perseus Cluster is an example of a black hole bellowing out energy and preventing the gas from cooling to form stars at a high rate. Repeated outbursts from the black hole in the center of Perseus, in the form of powerful jets, created giant cavities and produced sound waves with an incredibly deep B-flat note 57 octaves below middle C. Shock waves, akin to sonic booms in Earth's atmosphere, and the very deep sound waves release energy into the gas in Perseus, preventing most of it from cooling. In the case of the Phoenix Cluster, jets from the giant black hole in its central galaxy are not powerful enough to prevent the cluster gas from cooling. Correspondingly, any deep notes produced by the jets must be much weaker than needed to prevent cooling and star formation.
(Credit: NASA/CXC/IoA/A.Fabian et al.)
Return to Phoenix Cluster (August 15, 2012)
Revised: November 30, 2022